Tools
swiftsimio includes a few tools to help you make your visualisations
‘prettier’. Below we describe these tools and their use.
2D Color Maps
The swiftsimio.visualisation.tools.cmaps module includes three
objects that can be used to deploy two dimensional colour maps. The first,
LinearSegmentedCmap2D, and second
LinearSegmentedCmap2DHSV, allow
you to generate new color maps from sets of colors and coordinates.
bower = LinearSegmentedCmap2D(
   colors=[[1.0, 0.0, 0.0], [0.0, 1.0, 0.0], [0.0, 0.0, 1.0], [0.0, 0.0, 0.0]],
   coordinates=[[0.0, 0.0], [1.0, 0.0], [0.0, 1.0], [1.0, 1.0]],
   name="bower",
)
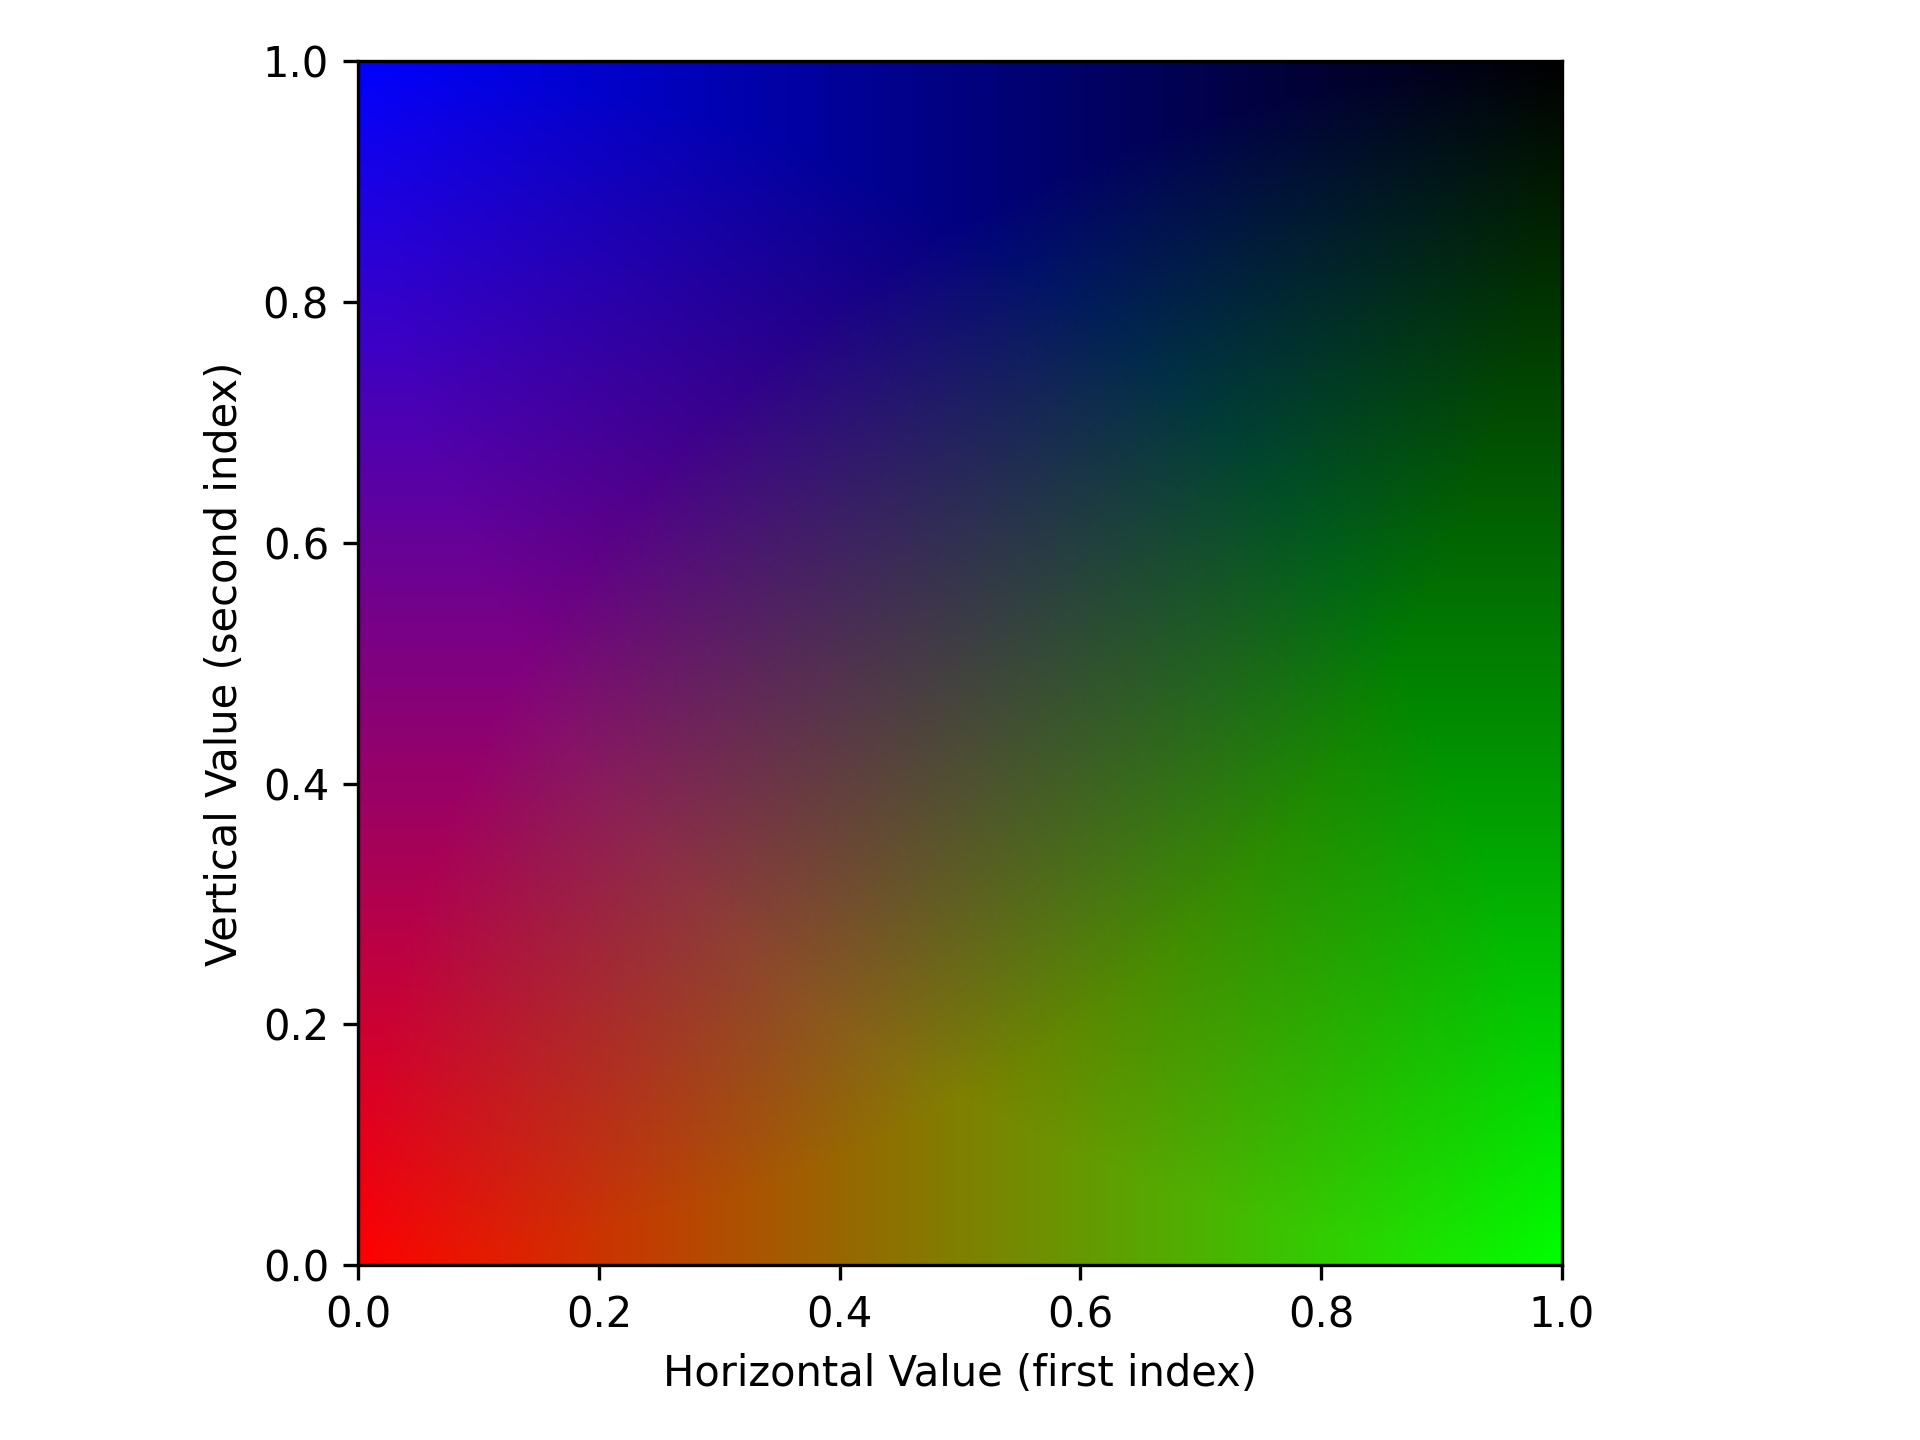
This generates a color map that is a quasi-linear interpolation between all
of the points. The map can be displayed using the plot()
function,
fig, ax = plt.subplots()
bower.plot(ax)
which generates:
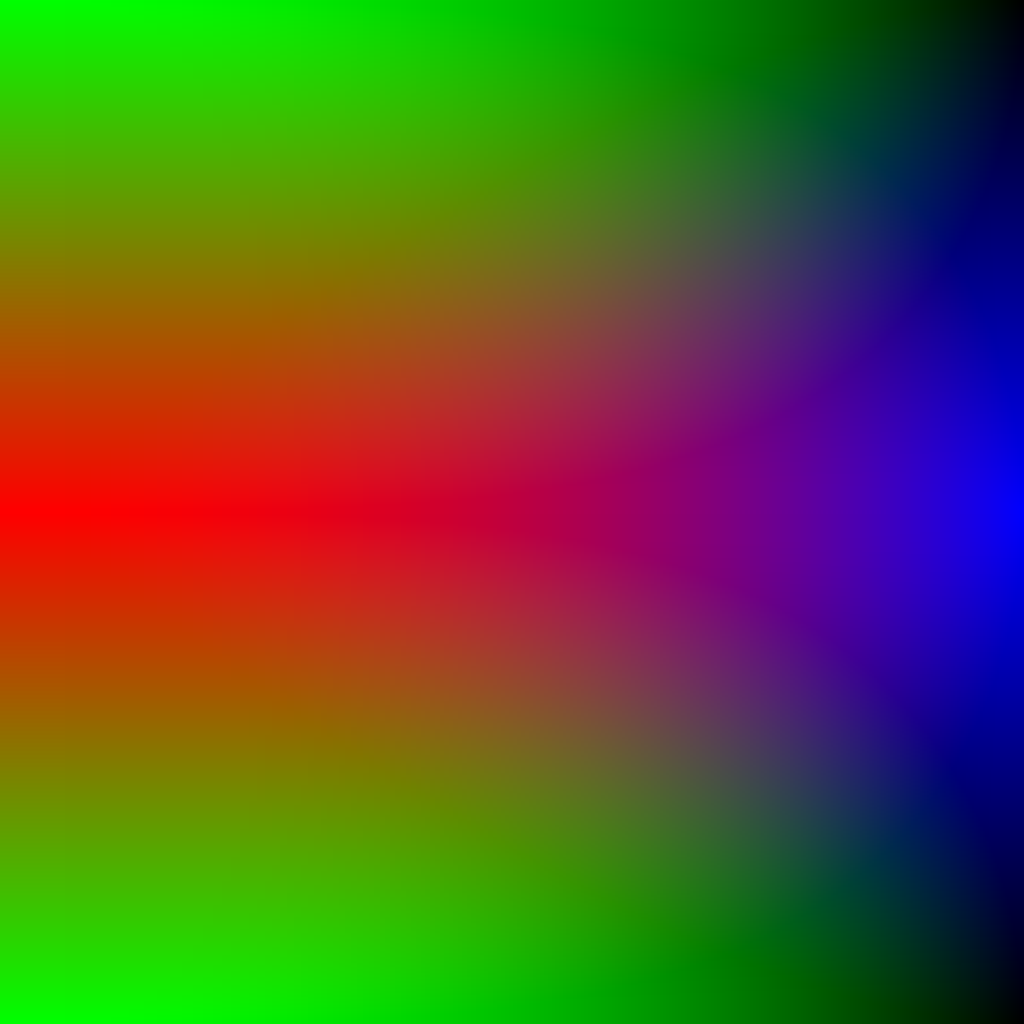
Finally, the color map can be applied to data by calling it:
def vertical_func(x):
    return abs(1.0 - 2.0 * x)

def horizontal_func(y):
    return y ** 2

raster_at = np.linspace(0, 1, 1024)

x, y = np.meshgrid(horizontal_func(raster_at), vertical_func(raster_at))

imaged = bower(x, y)

plt.imsave("test_2d_cmap_output.png", imaged)
Where here imaged is an RGBA array. This outputs:
The final type of 2D color map is loaded from an image, such as the one displayed below which is similar to the famous color map used for the Millenium simulation.
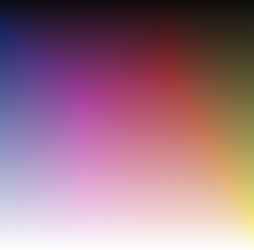
This can be loaded using the
swiftsimio.visualisation.tools.cmaps.ImageCmap2D class, as follows:
mill = ImageCmap2D(filename="millenium_cmap.png")
and can be used similarly to the other color maps. For the example above, this outputs the following:
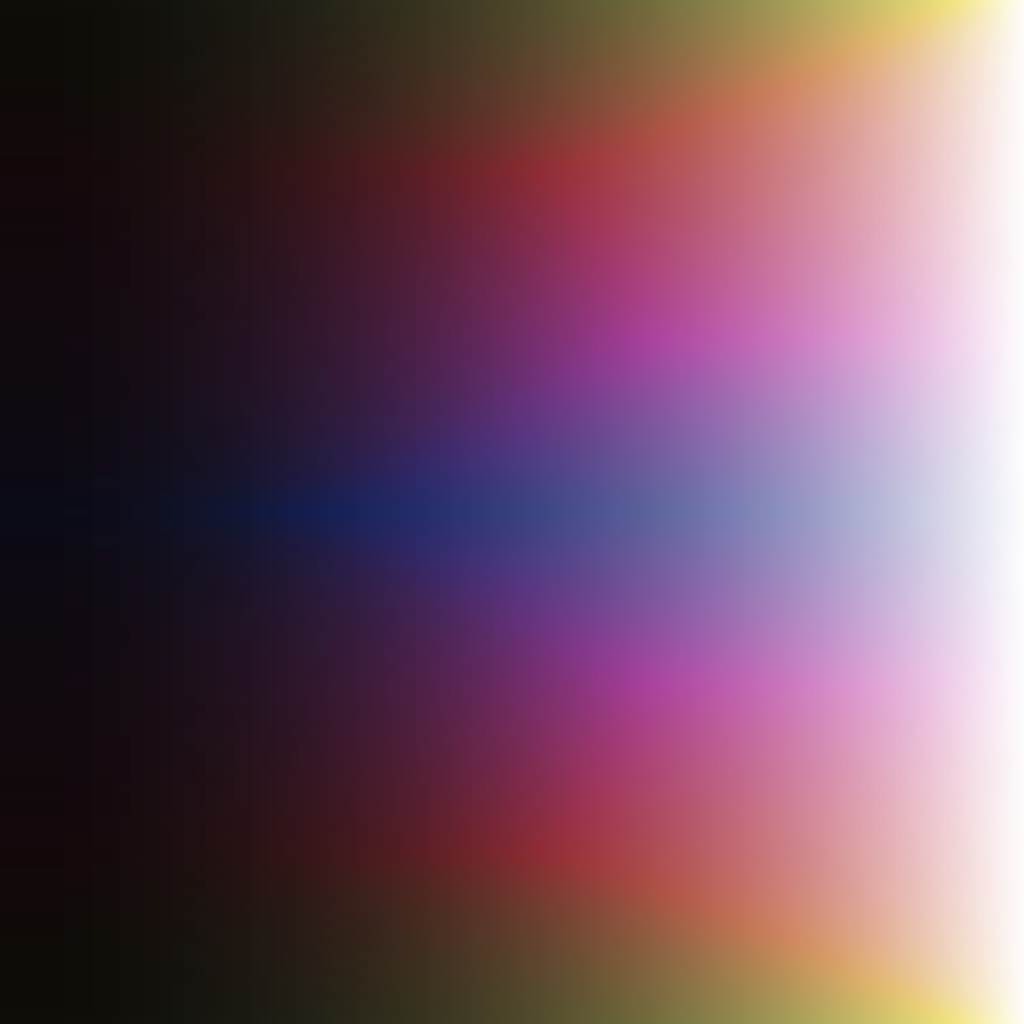
This is the recommended way to use two dimensional color maps, as their generation can be quite complex and best left to image-generation programs such as GIMP or Photoshop.